Savings Tracking Software

Procurement savings tracking software - because “we saved money” isn’t a metric.

Track, validate, and realize procurement savings with clear ownership, milestones, and audit-ready numbers.

G2 logo above five gold stars rating with one star half filled.
Rating of 4.8 out of 5 stars with profile pictures of four smiling diverse people in circles.Capterra logo with a 4.8 rating and five stars, one star partially filled.
Project status card showing 'In progress' for transportation contracts savings project with projected savings $24,852.86 and realized savings $28,262.74. Created by Jane Witney with due date 31 Dec. Description of competitive bidding for transportation contracts, 8 milestones with option to add new milestone, supplier ACME Solutions, linked to road transport services contract.
Bar chart titled Milestones showing realized savings of $33,643 and projected savings of $29,437, with monthly savings percentages: March 68%, April 53%, May 45%, June 59%, July 50%, August 50%.
Smiling man with dark hair and mustache wearing a blue shirt beside text stating savings project approved and Jane has approved your savings.
Smiling woman with curly hair wearing a green top next to text stating Savings Milestone Due In 7 Days and a reminder to please review and complete.
Gauge chart showing 72% realized savings compared to projected savings with €9,288 realized and €12,900 projected savings.
Dashboard showing Automated Milestone builder with baseline spend of $140K, 12 monthly milestones, projected savings of $12,000, $1,000 split per milestone, and total projected savings of 8.6%.
Dashboard card titled Complete Milestone showing realized cost reduction of $1,200, baseline spend of $28,800, and total realized savings of 12.85%, with a button labeled Mark as complete and a small user avatar.
THE STRATEGIC SAVINGS ENGINE

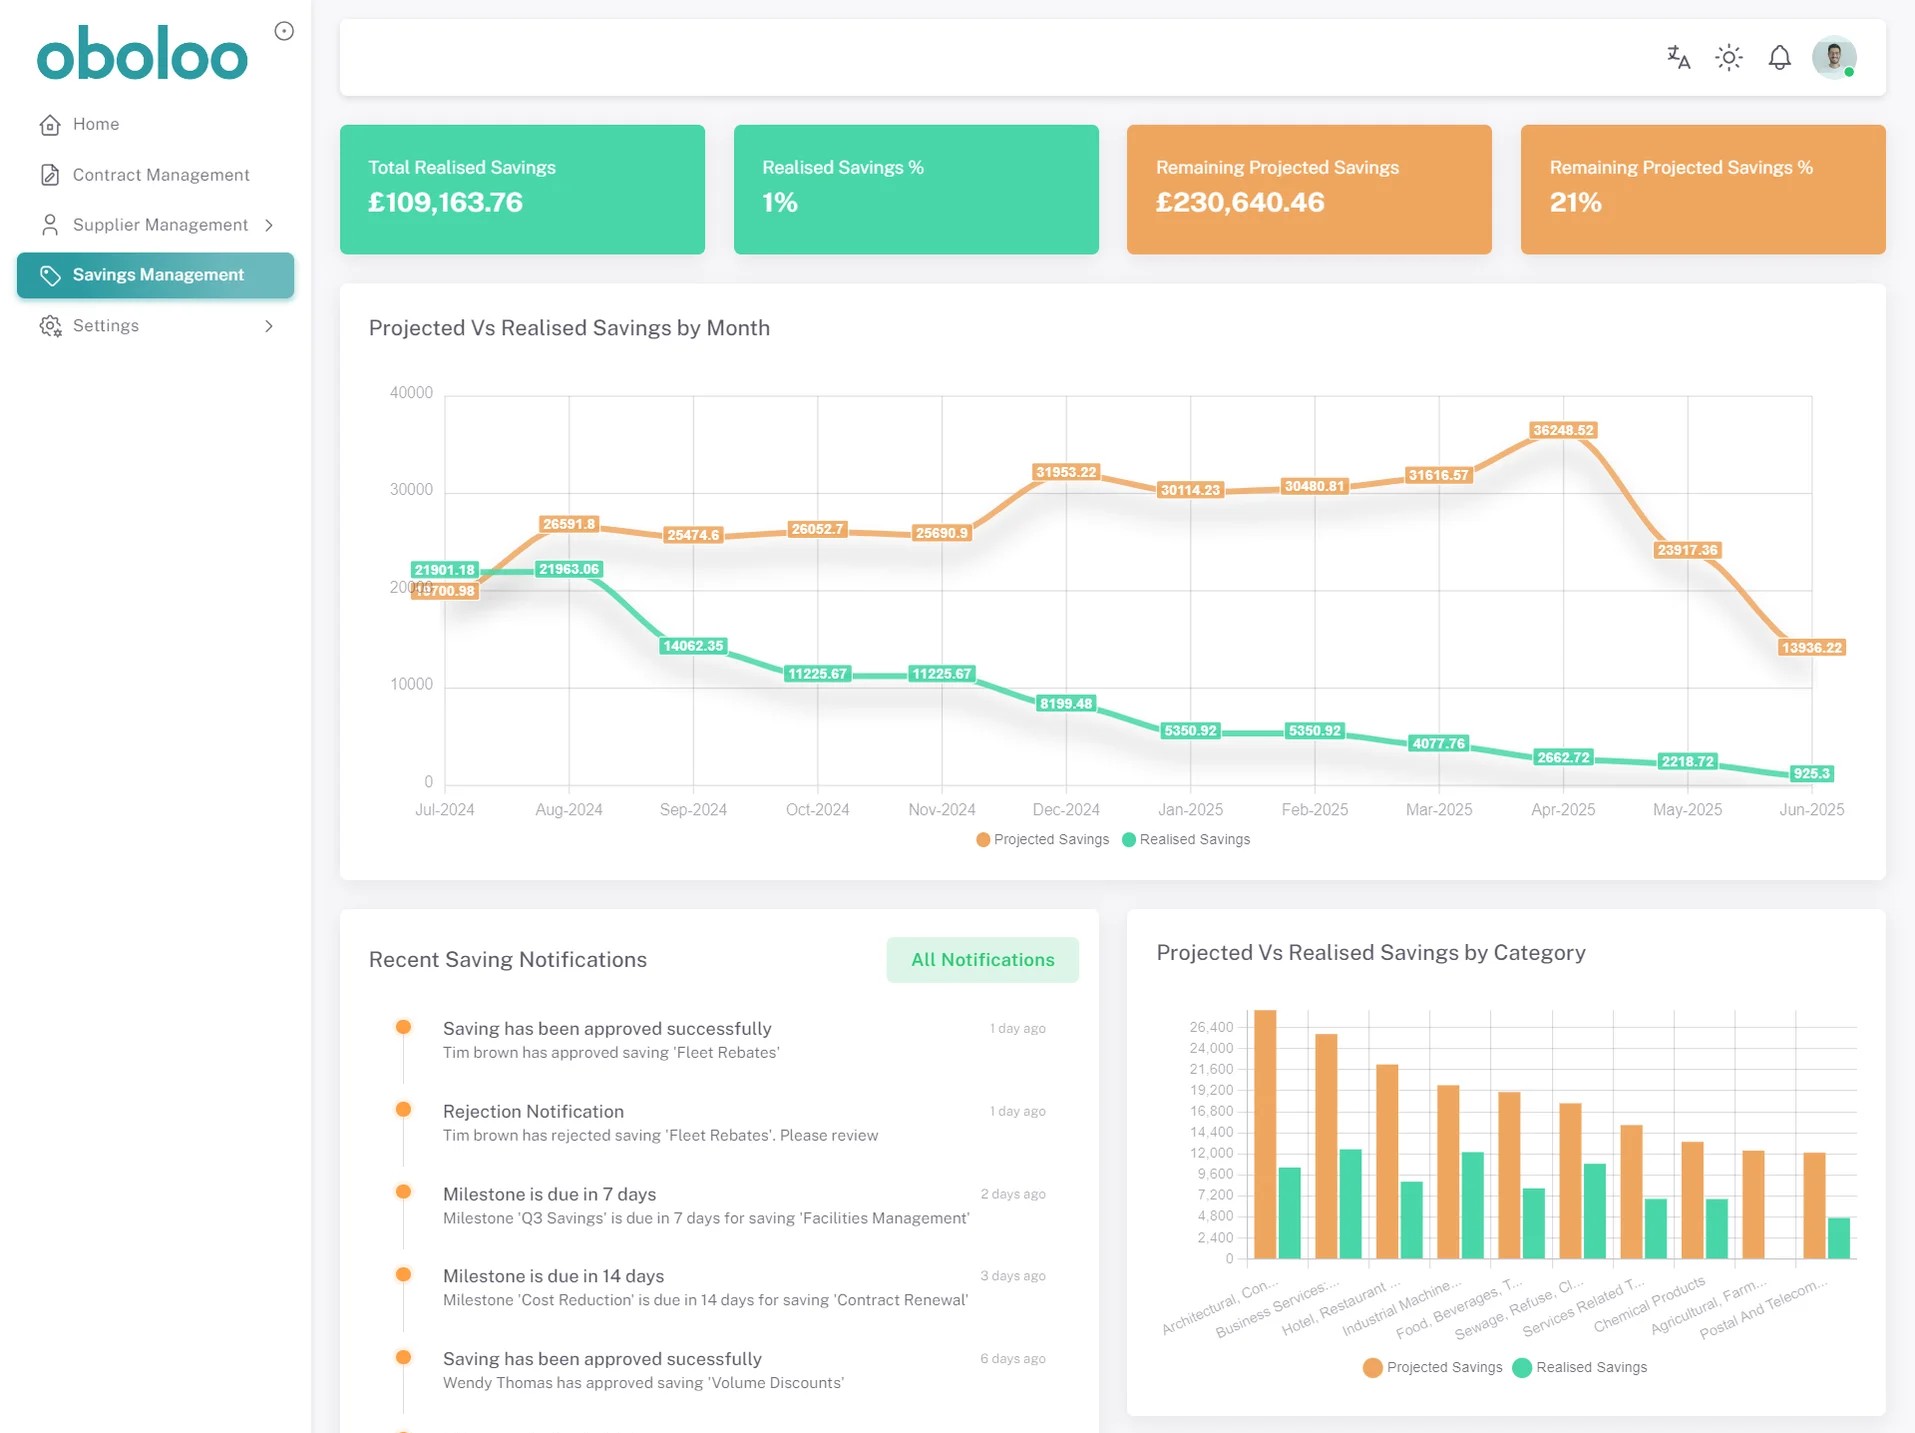
Make savings visible, measurable, and real

Project card titled 'Cost Reduction Project - 12 months' with three circular profile pictures of team members and placeholder text lines.
Captures every savings initiative

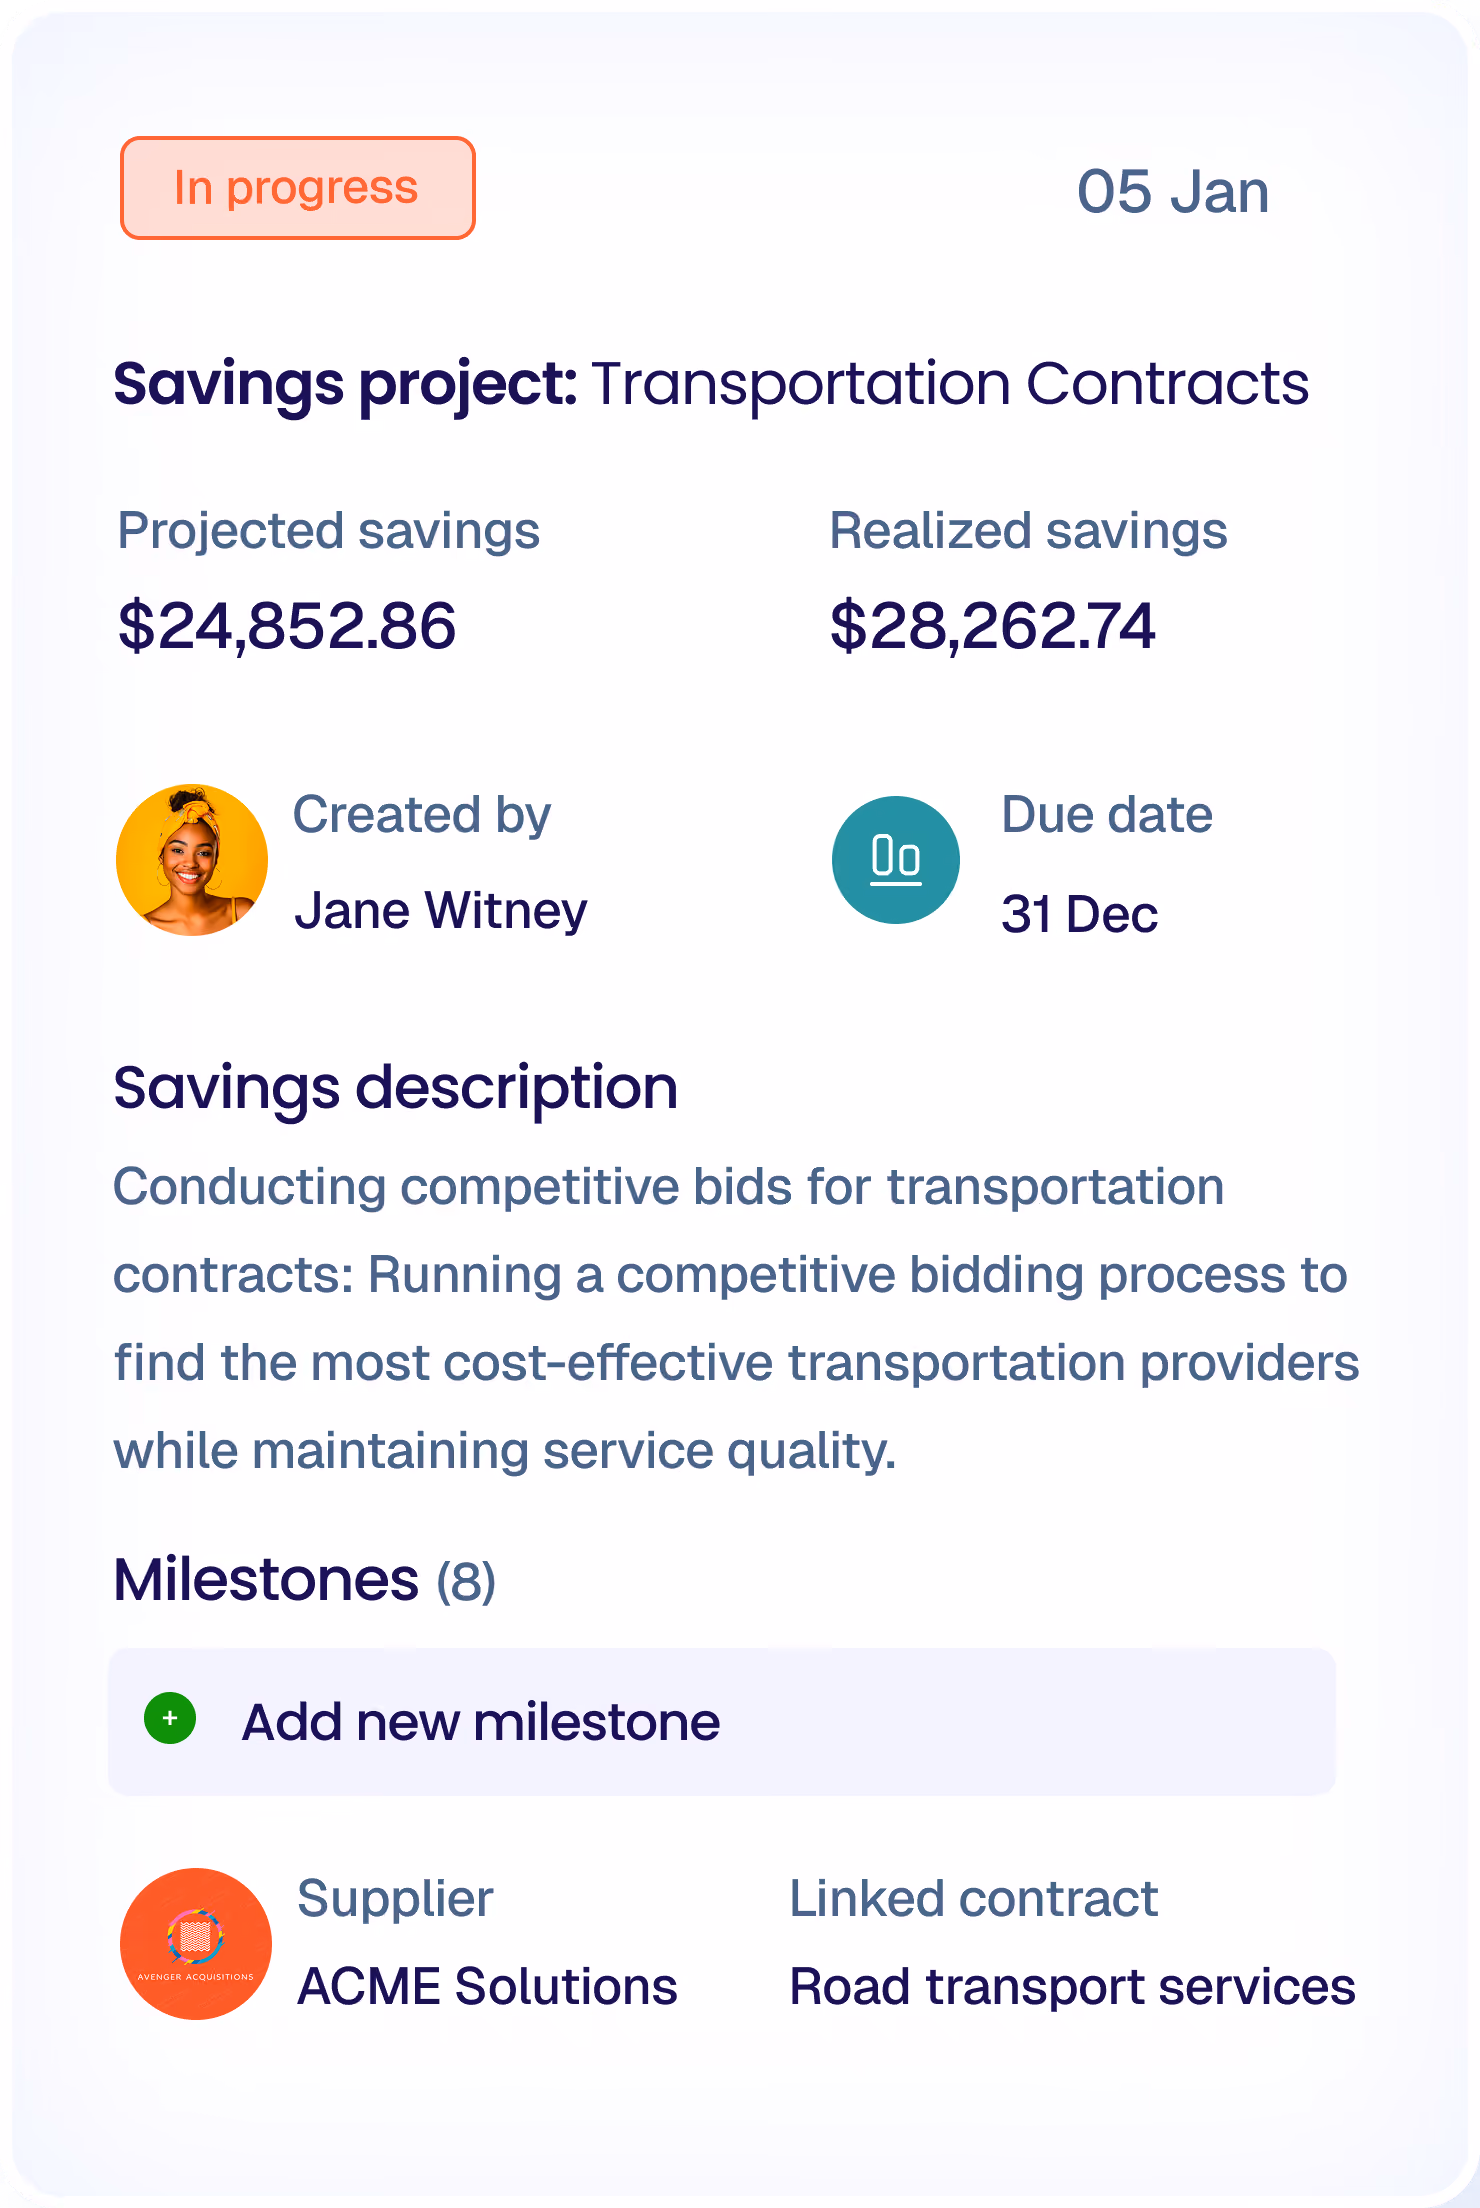
Log and centralise savings opportunities in one place—by category, supplier, or team. Everything tracked. Nothing forgotten

Savings Milestones bar chart showing pipeline savings of $23,500 with six milestones: $6.5k, $4k, $1.5k, $4.5k, $4k, and $3k.
Monitors milestones without the micromanagement

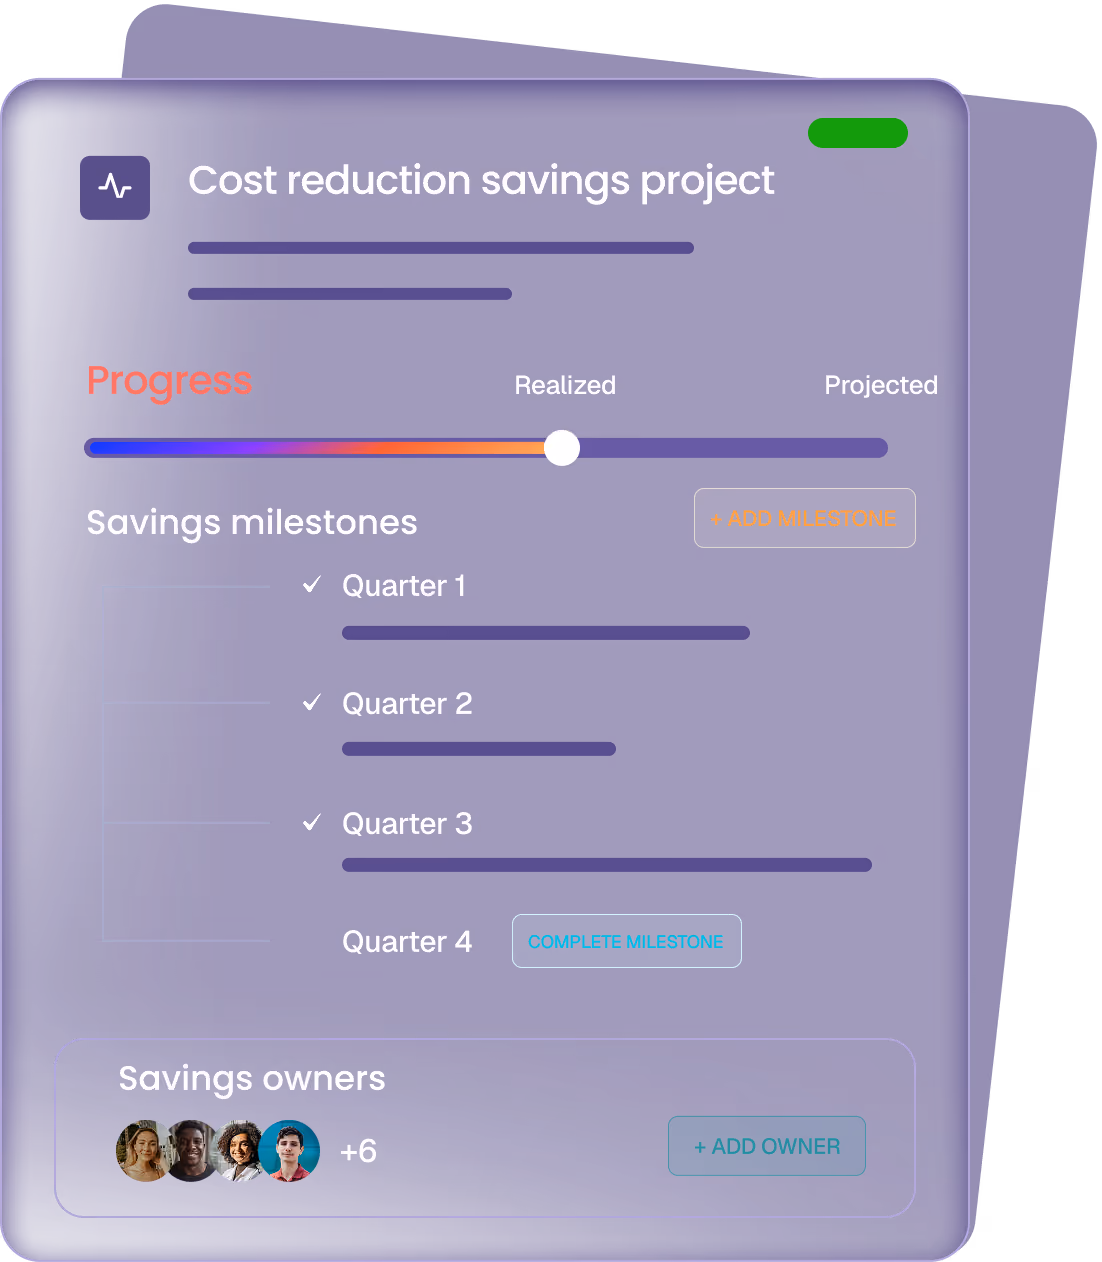
Break savings plans into milestones, set owners and due dates, and let the system nudge things forward automatically.

Gauge showing 76% realized savings versus projected savings with projected savings at $250,000 and realized savings at $190,000.
Confirms the numbers actually delivered

Validate and lock in savings with finance—compare forecast vs realised, and show the impact you’ve made with confidence.

Three semi-transparent squares with rounded corners overlapping, featuring a gradient of blue, purple, and red colors.
Cost reduction savings project dashboard showing progress bar, savings milestones for four quarters, and savings owners with profile pictures and add owner button.
End-To-end savings management

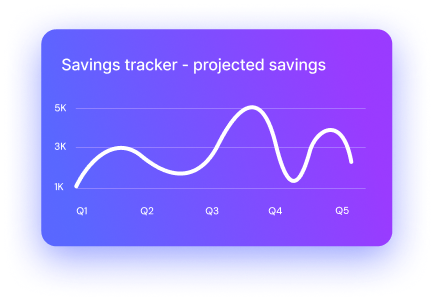
Forecast. Plan. Realize

Blue line art icon of a microscope.
Creates structured savings initiatives

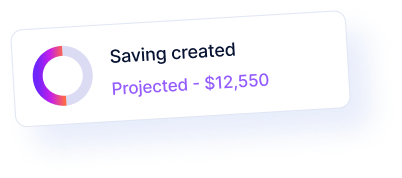
Log savings against projects, categories, or suppliers — define value, timeframe, and key milestone checkpoints.

Blue line art icon of a microscope.
Milestones that match how you work

Build your own milestone plans by phase, deliverable, or outcome — split values by month, quarter, or custom periods.

Blue line art icon of a microscope.
Track progress, mark off completions

Mark milestones as completed with real-time visibility for procurement, finance, and leadership — no chasing or double entry.

Blue line art icon of a microscope.
Turns tracked progress into reporting

Automatically shift savings into “realised” once milestones are hit — with reporting by project, team, supplier, and timeline.

The oboloo way

One solution for efficiency and team success

Ugly and full of formula errors

Spreadsheets

Tabs on tabs, formulas held together with fear and hope
One broken formula ruins the whole quarter’s savings picture
Everyone copies the wrong row, no one owns the truth
Colour-coded mayhem no one understands
Manual updates that get skipped when things get busy
No visibility, no reporting, just spreadsheet spaghetti
Free forever plan available

The oboloo way

Teal-colored hollow circular ring on a white background.
Structured savings records with audit trails, ownership, and accountability
Milestones split by month, quarter, or custom phase — no formulas needed
A single, centralised savings source of truth across the business
Clear statuses and real-time updates — no decoding required
Automated tracking from projected to realised — finance-ready savings, always
Still not sure?

Get started with out free forever plan. No limits, credit cards or expiry dates. Your new platform, free, forever. includes a 14-day free trial of all plus plans.

Free forever plan - Sign up
Features

Streamline workflows, save time, enhance performance

Savings progress bar showing 66% completed, 20% in progress, and 14% pending review as of 13 May, with latest update showing savings project approved by Dan on 24 May marked as Success.
Built to track savings properly

No more hacked spreadsheets or mystery tabs. Track initiatives by project, supplier, or category — with milestones, status, and owners baked in.

Milestone status chart dated 26 June showing progress bars for four milestones with varying shades of blue indicating completion levels.
taskopia-benefits-home-two-complete
Milestones, split your way

Split savings by month, quarter, or custom phases. See exactly what’s planned, in progress, and ready to drop to the bottom line.

Milestone realization panel showing projected savings $25,000, realized savings $27,500, and realized savings percentage 14.7% with a toggle switch on and a gradient blue button labeled Realize milestone.
One-click realization

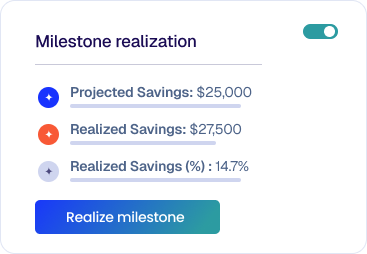
When a milestone is hit, mark it complete — oboloo updates your forecast and realized savings, no recalcs needed.

Line graph titled Savings tracker showing realized savings and projected savings trends, with three small profile pictures in the top right corner.
taskopia-home-two-0.55
Flexible, configurable, yours

Add custom fields, define initiative types, tailor categories — savings tracking that matches how you work, not the other way around.

All changes and approvals in one place
Audit trails that finance loves
Savings Change Log interface showing a profile picture, a button labeled 'Change To Milestone End Date', and update details with date 2nd June and updated by Mark Jones.
Savings Approval Log interface showing one entry marked Approved and two entries marked Rejected.
All Supplier Data. One Record.

A single source of truth for your teams savings

Savings management dashboard showing total realised savings of £109,163.76, realised savings 1%, remaining projected savings £230,640.46 (21%). Line chart compares projected and realised savings by month from July 2024 to June 2025. Bar chart compares projected and realised savings by category. Recent notifications about savings approvals, rejections, and milestones are listed on the left.
Microsoft Teams logo featuring two stylized user icons in blue and purple with a 'T' on a square overlay.
Salesforce logo with white text on a blue background.
Green letter F with a leaf detail inside a blue rounded leaf-shaped background.
Xero brand name in white lowercase letters inside a blue circle.
Text reading 'Create new saving initiative' on a light gradient background with rounded corners and dashed lines.
Card showing a circular progress chart with text 'Saving created' and 'Projected - $12,550' in purple.
Smiling woman with a yellow headwrap and earrings against a yellow background.
Line graph titled Savings tracker - projected savings, showing savings amounts from Q1 to Q5 fluctuating between 1K and 5K.
Smiling young man with brown hair and mustache wearing a blue shirt against a pink circular background.
Notification box with text saying 'Savings approved!' and two placeholder lines below.
track savings initiatives

Turn savings ideas into trackable progress

No more guesswork or lost spreadsheets — every savings initiative starts life structured, owned, and already on track.

Speech bubble with an exclamation mark inside, indicating feedback or alert.
Build from scratch or replicate past wins

Spin up new initiatives in seconds or use existing ones as templates — same workflow, less admin.

Icon of two hands shaking, symbolizing agreement or partnership.
Stay on top of progress, not buried in it

Initiatives are automatically assigned, timestamped, and monitored — no more mystery tasks or missing owners.

SAvings Milestones

Break it down. Hit the numbers.

Milestones split your savings targets across time or steps — so delivery is steady, manageable, and measurable.

Blue circular arrows forming a refresh or sync icon.
Milestones on your terms

Add one or many, across any timeframe — monthly, quarterly, yearly. You control the rhythm of delivery.

Icon of a heart rate monitor displaying a pulse line.
Timeline meets accountability

Every milestone is assigned, tracked, and visible in reporting — so nothing slips and no one hides.

Bar chart showing milestone overview for contract renewal cost reduction project, comparing projected savings and realized savings for four milestones.
Soft gradient background blending pastel hues of blue, pink, and purple with a small dotted L-shaped line near the upper right area.
Card showing realized savings of $14,670 with a 14.8% increase against baseline.
Bar chart showing realized savings with varying amounts, highest bar around $30,000, projected savings for period $63,500.
Notification with a smiling woman’s profile picture and text stating 'Savings milestone complete!' on a dark purple background.
Savings validation & realization

Show what you’ve saved, without proving it twice

Once a milestone is hit, it’s not just a tick box — it’s fully validated and realised savings, automatically logged.

Icon of a document with a pencil, representing editing or writing.
From planned to proven

Mark milestones complete and the system instantly flags savings as realised — no rework, no second process.

Icon of a building with multiple floors and windows representing corporate fare.
Audit-ready at every step

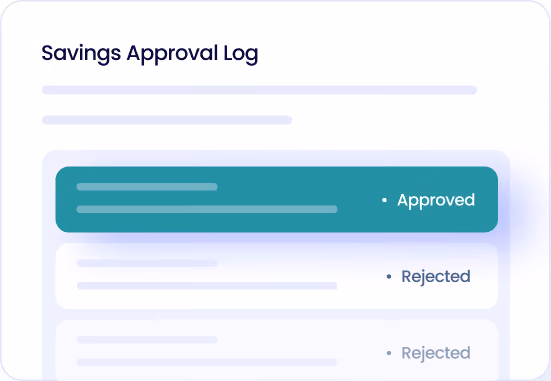
Each realised saving comes with timestamped evidence, owner details, and a full validation trail — for audits or boardrooms alike.

integration

Integrate your apps
with no-code

See all apps
taskopia-home-two-overlay-integration
Row of four smiling diverse young adults in circular frames with pastel-colored backgrounds.
Join 2000+ happy users

Migrate from your Excel savings tracker today

White arrow curved upward and pointing right on a black background.
Quick Answers

Procurement Savings Tracking Software FAQ's

What counts as a "saving" in oboloo?
Does it track realized vs. forecast savings?
Does the savings management support different currencies?
How do I prove these savings to my Finance team?
Can I track savings across different departments?
Is oboloo really free?